
https://www.kaggle.com/jamesleslie/titanic-neural-network-for-beginners
titanic-neural-network-for-beginners :
Summary:
Create_model is the key concept in the whole algorithm.
def create_model(lyrs=[8], act='linear', pt='Adam', dr=0.0):
used GridsearchCV to find the best Hyperparameter Tuning.
Hyperparameters: batch_size , epochs , optimizer , layers and drops
Hyperparameter Tuning
Grid searchCV - batch size and epochs
batch_size = [16, 32, 64]
epochs = [50, 100]
Best: 0.822671 using {'batch_size': 32, 'epochs': 50}
===================================================
Grid searchCV - Optimization Algorithm
optimizer = ['SGD', 'RMSprop', 'Adagrad', 'Adadelta', 'Adam', 'Nadam']
Best: 0.822671 using {'opt': 'Adam'}
===================================================
Grid searchCV - Hidden neurons
layers = [[8],[10],[10,5],[12,6],[12,8,4]]
Best: 0.822671 using {'lyrs': [8]}
===================================================
Grid searchCV - Dropout
drops = [0.0, 0.01, 0.05, 0.1, 0.2, 0.5]
Best: 0.824916 using {'dr': 0.2}
===================================================
model = create_model(lyrs=[8], dr=0.2)
training = model.fit(X_train, y_train, epochs=50, batch_size=32,
validation_split=0.2, verbose=0)
Still have few questions --
a. Initial train model given val_acc: 86.53% but where as train model at the end given acc: 83.16%
b. making batch size and epochs as constant values and then the remaining hyperparmaters found the best value
rather than adding one hyperparameter and then another hyperparameter.
Credit to
https://towardsdatascience.com/https-medium-com-vishalmorde-xgboost-algorithm-long-she-may-rein-edd9f99be63d

XGBoost is a decision-tree-based ensemble Machine Learning algorithm that uses a gradient boosting framework. In prediction problems involving unstructured data (images, text, etc.) artificial neural networks tend to outperform all other algorithms or frameworks. However, when it comes to small-to-medium structured/tabular data, decision tree based algorithms are considered best-in-class right now.
The algorithm differentiates itself in the following ways:
Imagine that you are a hiring manager interviewing several candidates with excellent qualifications. Each step of the evolution of tree-based algorithms can be viewed as a version of the interview process.

System Optimization:
Algorithmic Enhancements:
Credit to
https://towardsdatascience.com/validating-your-machine-learning-model-25b4c8643fb7
The following methods for validation will be demonstrated:

Numerical data can be scaled to ensure proportionate influence on the prediction
Common techniques for scaling
So how do we do it, exactly? How can we align different features into the same scale?
Keep in mind that not all ML algorithms will be sensitive to different scales of inputted features. Here is a collection of commonly used scaling and normalizing transformations that we usually use for data science and ML projects:

In this example, you have the one column called home Type, and three different levels: House, Apartment, and Condo. The data frame has five observations for that particular feature.
With one-hot encoding, you convert this one column of home Type into three columns: a column for House, a column for Apartment, and a column for Condo. You encode each observation with either a 1 or 0: 1 to indicate the home type of that particular observation, or 0 for the other options.
============================================================
Topics related to this subdomain
Here are some topics you may want to study for more in-depth information related to this subdomain:
Scaling
Normalizing
Dimensionality reduction
Date formatting
One-hot encoding
VISUALIZING UNIVARIATE CONTINUOUS DATA
Uni-variate plots are of two types:
1)Enumerative plots and
2)Summary plots
Univariate enumerative Plots :
These plots enumerate/show every observation in data and provide information about the distribution of the observations on a single data variable. We now look at different enumerative plots.
examples:
1. UNIVARIATE SCATTER PLOT
2. LINE PLOT (with markers)
3. STRIP PLOT
4. SWARM PLOT
Uni-variate summary plots :
These plots give a more concise description of the location, dispersion, and distribution of a variable than an enumerative plot. It is not feasible to retrieve every individual data value in a summary plot, but it helps in efficiently representing the whole data from which better conclusions can be made on the entire data set.
5. HISTOGRAMS
6. DENSITY PLOTS
7. RUG PLOTS
8. BOX PLOTS
9. distplot() :
10. VIOLIN PLOTS
VISUALIZING CATEGORICAL VARIABLES :
11. BAR CHART :
12. PIE CHART :
https://www.analyticsvidhya.com/blog/2020/07/univariate-analysis-visualization-with-illustrations-in-python/
In machine learning, a hyperparameter (sometimes called a tuning or training parameter) is defined as any parameter whose value is set/chosen at the onset of the learning process. Whereas other parameter values are computed during training.
K-Nearest Neighbors : K , Leaf_size , Weights and Metric
Decision Trees and Random Forests : N_estimators, Max_depth , Min_samples_split , Min_samples_leaf and Criterion
AdaBoost and Gradient Boost : N_estimators, Learning_rate and Base_estimator (AdaBoost) / Loss (Gradient Boosting)
Support Vector Machines : C, Kernel, and Gamma.
Specifically, I will focus on the hyperparameters that tend to have the greatest effect on the bias-variance tradeoff
However, it is very, very important to keep in mind the bias-variance tradeoff, as well as the tradeoff between computational costs and scoring metrics. Ideally, we want a model with low bias and low variance to limit overall error
https://medium.com/swlh/the-hyperparameter-cheat-sheet-770f1fed32ff
The Hyperparameter Cheat Sheet A quick guide to hyperparameter tuning utilizing Scikit Learn’s GridSearchCV, and the bias/variance trade-off
J.P. Rinfret
---------------------------------------------------------------------------------------------------------------------
=====================================================================
https://towardsdatascience.com/model-parameters-and-hyperparameters-in-machine-learning-what-is-the-difference-702d30970f6
Examples of hyperparameters used in the scikit-learn package
1.Perceptron Classifier
Perceptron(n_iter=40, eta0=0.1, random_state=0)
2. Train, Test Split Estimator
train_test_split( X, y, test_size=0.4, random_state=0)
3. Logistic Regression Classifier
LogisticRegression(C=1000.0, random_state=0)
4. KNN (k-Nearest Neighbors) Classifier
KNeighborsClassifier(n_neighbors=5, p=2, metric='minkowski')
5. Support Vector Machine Classifier
SVC(kernel='linear', C=1.0, random_state=0)
6. Decision Tree Classifier
DecisionTreeClassifier(criterion='entropy',
max_depth=3, random_state=0)
7. Lasso Regression
Lasso(alpha = 0.1)
8. Principal Component Analysis
PCA(n_components = 4)
-- https://www.youtube.com/watch?v=VL4NC4f6m0w
---------------------------------------------------
---------------------------------------------------
Why Tensors
Incorporate higher order relationships in data.
Discover hidden topics (not possible with matrix methods)
Tensor algebra is parallellizable like linear algebra
Faster than other algorithms for LDA.
Flexible: Training and inference decoupled
Guaranteed in theory to converge to global optimum.
---------------------------------------------------
https://medium.com/data-for-ai/what-is-a-feature-store-for-ml-29b62580af5d
https://hopsworks.readthedocs.io/en/latest/featurestore/guides/featurestore.html
https://hopsworks.readthedocs.io/en/latest/featurestore/guides/featurestore.html#technical-details-on-the-architecture
KNN
distance methods --- 3
lazy / instance based
K value -- based on even / odd y value
Accuracy Score vs F1 Score.


1 — Precision: It is implied as the measure of the correctly identified positive cases from all the predicted positive cases. Thus, it is useful when the costs of False Positives is high.

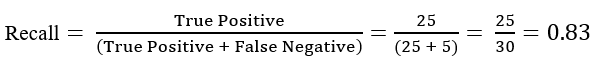
2 — Recall: It is the measure of the correctly identified positive cases from all the actual positive cases. It is important when the cost of False Negatives is high.
3 — Accuracy: One of the more obvious metrics, it is the measure of all the correctly identified cases. It is most used when all the classes are equally important.

Now for our above example, suppose that there only 30 patients who actually have cancer. What if our model identifies 25 of those as having cancer?
The accuracy in this case is = 90% which is a high enough number for the model to be considered as ‘accurate’. However, there are 5 patients who actually have cancer and the model predicted that they don’t have it. Obviously, this is too high a cost. Our model should try to minimize these False Negatives.
For these cases, we use the F1-score.
4 — F1-score: This is the harmonic mean of Precision and Recall and gives a better measure of the incorrectly classified cases than the Accuracy Metric.
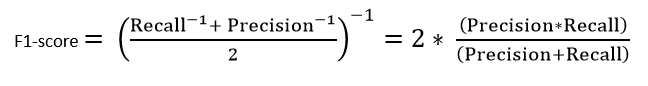
We use the Harmonic Mean since it penalizes the extreme values.
To summarise the differences between the F1-score and the accuracy,
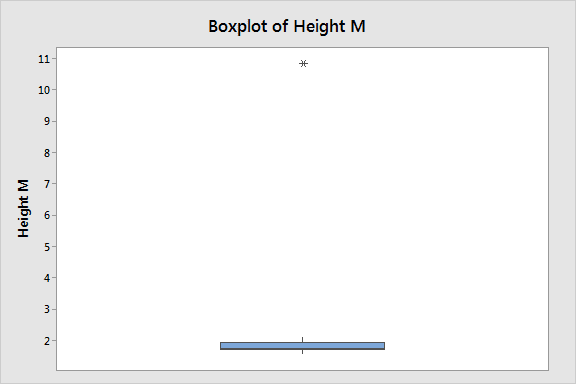
Outliers are data points that are far from other data points. In other words, they’re unusual values in a dataset. Outliers are problematic for many statistical analyses because they can cause tests to either miss significant findings or distort real results.
A single outlier can distort reality. A single value changes the mean height by 0.6m (2 feet) and the standard deviation by a whopping 2.16m (7 feet)!
There are a variety of ways to find outliers. All these methods employ different approaches for finding values that are unusual compared to the rest of the dataset. I’ll start with visual assessments and then move onto more analytical assessments.

Boxplots, histograms, and scatterplots can highlight outliers


Z-scores can quantify the unusualness of an observation when your data follow the normal distribution. Z-scores are the number of standard deviations above and below the mean that each value falls. For example, a Z-score of 2 indicates that an observation is two standard deviations above the average while a Z-score of -2 signifies it is two standard deviations below the mean. A Z-score of zero represents a value that equals the mean.


