Outliers are data points that are far from other data points. In other words, they’re unusual values in a dataset. Outliers are problematic for many statistical analyses because they can cause tests to either miss significant findings or distort real results.
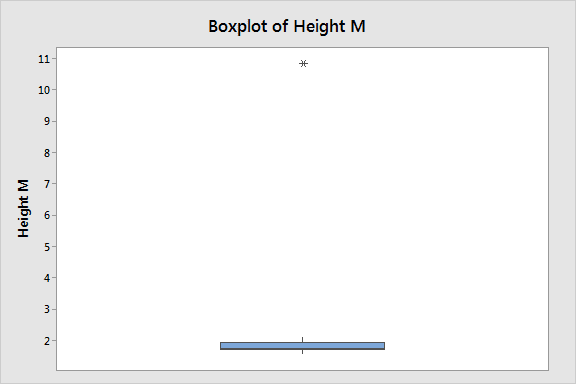
A single outlier can distort reality. A single value changes the mean height by 0.6m (2 feet) and the standard deviation by a whopping 2.16m (7 feet)!
There are a variety of ways to find outliers. All these methods employ different approaches for finding values that are unusual compared to the rest of the dataset. I’ll start with visual assessments and then move onto more analytical assessments.

Graphing Your Data to Identify Outliers
Boxplots, histograms, and scatterplots can highlight outliers


Z-scores can quantify the unusualness of an observation when your data follow the normal distribution. Z-scores are the number of standard deviations above and below the mean that each value falls. For example, a Z-score of 2 indicates that an observation is two standard deviations above the average while a Z-score of -2 signifies it is two standard deviations below the mean. A Z-score of zero represents a value that equals the mean.


No comments:
Post a Comment