What should and should not be done when facing an imbalanced classes Problem?
Now, the following are the fundamental metrics for the above data:
1 — Precision: It is implied as the measure of the correctly identified positive cases from all the predicted positive cases. Thus, it is useful when the costs of False Positives is high.
Precision
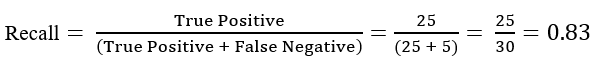
2 — Recall: It is the measure of the correctly identified positive cases from all the actual positive cases. It is important when the cost of False Negatives is high.
Recall
3 — Accuracy: One of the more obvious metrics, it is the measure of all the correctly identified cases. It is most used when all the classes are equally important.
Accuracy
Now for our above example, suppose that there only 30 patients who actually have cancer. What if our model identifies 25 of those as having cancer?
The accuracy in this case is = 90% which is a high enough number for the model to be considered as ‘accurate’. However, there are 5 patients who actually have cancer and the model predicted that they don’t have it. Obviously, this is too high a cost. Our model should try to minimize these False Negatives.
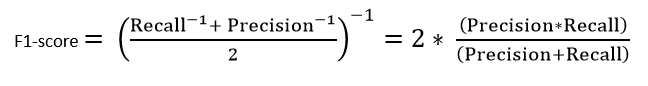
For these cases, we use the F1-score.
4 — F1-score: This is the harmonic mean of Precision and Recall and gives a better measure of the incorrectly classified cases than the Accuracy Metric.
F1-Score
We use the Harmonic Mean since it penalizes the extreme values.
To summarise the differences between the F1-score and the accuracy,
Accuracy is used when the True Positives and True negatives are more important while F1-score is used when the False Negatives and False Positives are crucial
Accuracy can be used when the class distribution is similar while F1-score is a better metric when there are imbalanced classes as in the above case.
In most real-life classification problems, imbalanced class distribution exists and thus F1-score is a better metric to evaluate our model on.
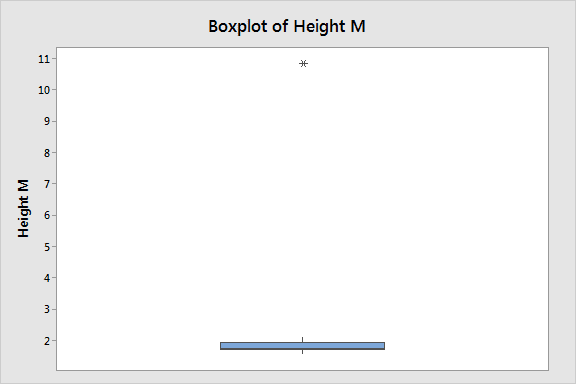
Outliers are data points that are far from other data points. In other words, they’re unusual values in a dataset. Outliers are problematic for many statistical analyses because they can cause tests to either miss significant findings or distort real results.
A single outlier can distort reality. A single value changes the mean height by 0.6m (2 feet) and the standard deviation by a whopping 2.16m (7 feet)!
There are a variety of ways to find outliers. All these methods employ different approaches for finding values that are unusual compared to the rest of the dataset. I’ll start with visual assessments and then move onto more analytical assessments.
Sorting Your Datasheet to Find Outlier
Graphing Your Data to Identify Outliers
Boxplots, histograms, and scatterplots can highlight outliers
Using Z-scores to Detect Outliers
Z-scores can quantify the unusualness of an observation when your data follow the normal distribution. Z-scores are the number of standard deviations above and below the mean that each value falls. For example, a Z-score of 2 indicates that an observation is two standard deviations above the average while a Z-score of -2 signifies it is two standard deviations below the mean. A Z-score of zero represents a value that equals the mean.
Using the Interquartile Range to Create Outlier Fences